Evaluating Energy Efficiency and Performance in Serving Large Language Models
Large Language Models (LLMs) are increasingly integrated into production systems across industries. These models require significant computational resources while serving, especially when deployed at scale.
1. Introduction
According to the International Energy Agency (IEA), global data center electricity consumption reached approximately 460 TWh in 2022, accounting for about 1.5% of global electricity demand. This is projected to rise significantly by 2026, with AI workloads, especially large-scale inference being a key contributor.
For data center operators, this trend introduces challenges related to infrastructure scaling, operational expenditure, and sustainability. LLM inference in particular involves complex trade-offs between latency, throughput, and power consumption. As energy costs rise, evaluating models not only by throughput and latency but also by efficiency metrics such as energy per request and tokens per joule (TPJ) becomes increasingly important.
This study analyzes how batch size and GPU frequency impact the energy efficiency and performance of LLM inference using Meta's LLaMA-3.1-8B model.
2. The Challenge of Energy-Efficient LLM Serving
Inference with large language models (LLMs) introduces distinctive challenges due to their autoregressive decoding behavior, where tokens are generated sequentially. Unlike conventional inference, the computational workload during LLM decoding evolves over time and depends on parameters like batch size and decoding length.
This study focuses specifically on the decoding stage of inference. Each input consists of a single token, and the model is tasked with generating 512 output tokens. This controlled setup allows consistent evaluation of compute load and power draw across different runs while excluding variability introduced by prompt length.
Traditional Power Management
Traditional power management techniques such as static power capping are often suboptimal for LLM workloads.
A central metric in this study is Tokens per Joule (TPJ), defined as the number of generated tokens divided by the energy consumed during decoding. TPJ captures both throughput and power efficiency, making it a useful composite indicator of overall inference cost-effectiveness. Since energy is computed as power integrated over time, TPJ also implicitly accounts for how fast tokens are generated and how much power the system uses during that time.
Understanding how TPJ responds to different batch sizes and GPU frequencies is critical for identifying configurations that deliver high generation throughput while minimizing energy expenditure.
While Tokens per Joule (TPJ) is the primary metric for assessing energy efficiency, it does not capture all relevant performance trade-offs. Depending on the deployment objective—whether minimizing power costs, reducing response time, or maximizing throughput—different metrics become more appropriate.
3. Metrics and Evaluation Goals
This study reports multiple performance and efficiency metrics to guide configuration selection based on three common serving goals:
Energy-Efficient Serving
Key metrics: Tokens per Joule (TPJ), Energy per Request, Average Power Consumption.
Suitable for cost-sensitive LLM deployments, where minimizing energy use is a priority.
Use Case
Lowering electricity and cooling costs in data centers.
Latency-Sensitive Serving
Key metrics: End-to-End Latency, Time Between Tokens (TBT)
Applies to interactive/streaming applications, where fast output tokens are needed for responsiveness.
Use Case
Conversational AI chatbot expecting near real-time outputs.
Throughput-Driven Serving
Key metric: Tokens per Second (TPS)
Relevant for high-throughput inference pipelines.
Use Case
LLM API behind coding assistants or enterprise SaaS tools.
Trade-offs
These modes represent trade-offs. Understanding the relationship between batch size, GPU frequency, and each metric helps guide configuration choices depending on the specific LLM use case.
4. Results and Discussion
4.1 Energy Efficiency Analysis
Tokens per Joule (TPJ) improves with both batch size and GPU frequency, peaking around Batch 32 at 1000–1400 MHz. Energy per request drops significantly with larger batches, making them more efficient overall. However, average power also increases as batch size and frequency rise, which may limit how aggressively these settings can be used in practice.
Key Finding
Large batch size at moderate GPU frequencies (1000–1400 MHz) offers the best energy efficiency while keeping power draw manageable.
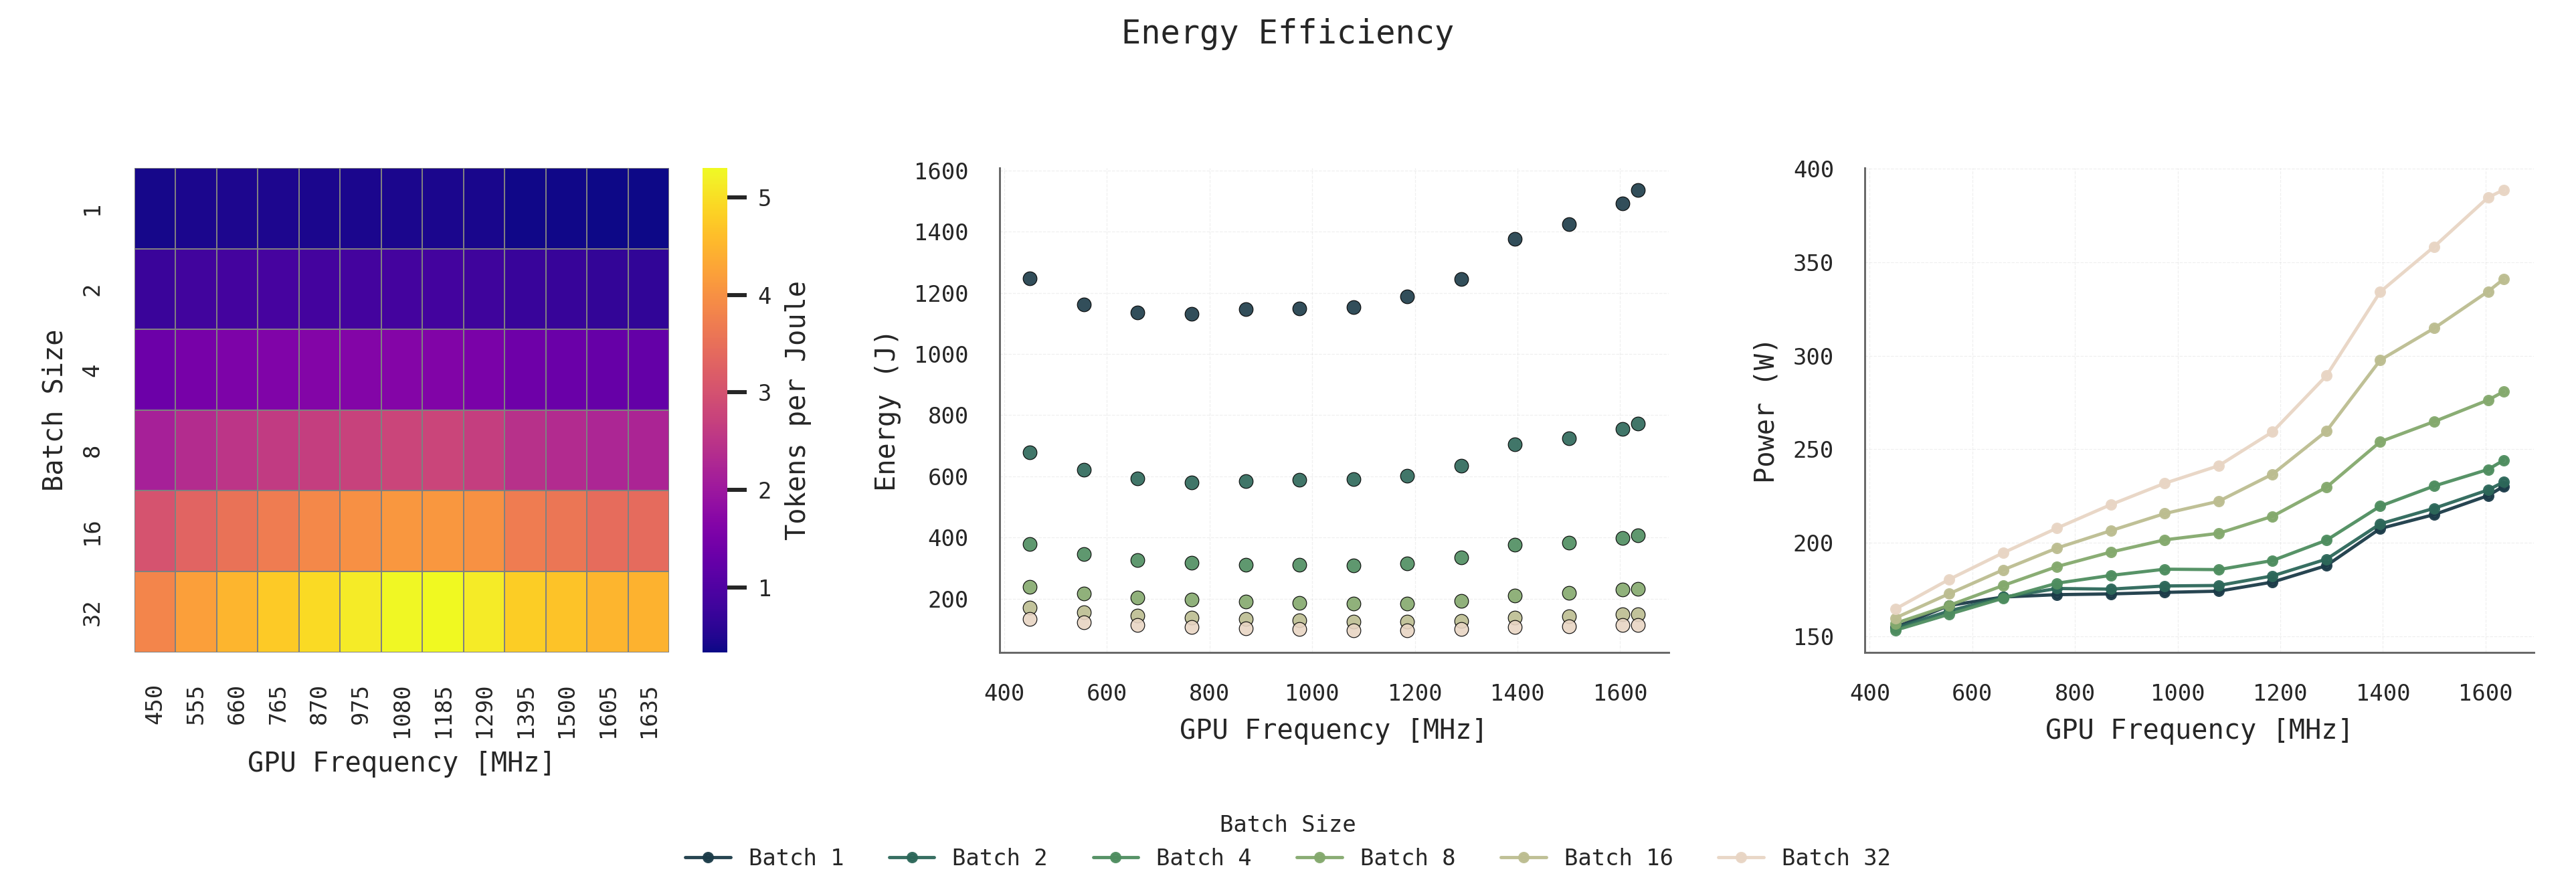 Figure 1: Energy Efficiency: Energy metrics across batch sizes and GPU frequencies, showing trade-offs in tokens per joule, energy per request, and power consumption.
4.2 Latency Analysis
Latency decreases with smaller batch sizes and higher GPU frequencies. Batch 1 consistently shows the lowest Time Between Tokens (TBT) and End-to-End latency across all settings. Larger batches incur higher latency, which can be mitigated but not eliminated by increasing the frequency. For batch sizes 1 and 2, latency is already low, and increasing GPU frequency beyond 700–800 MHz offers minimal improvement making these lower frequencies a good trade-off point for reduced power consumption.
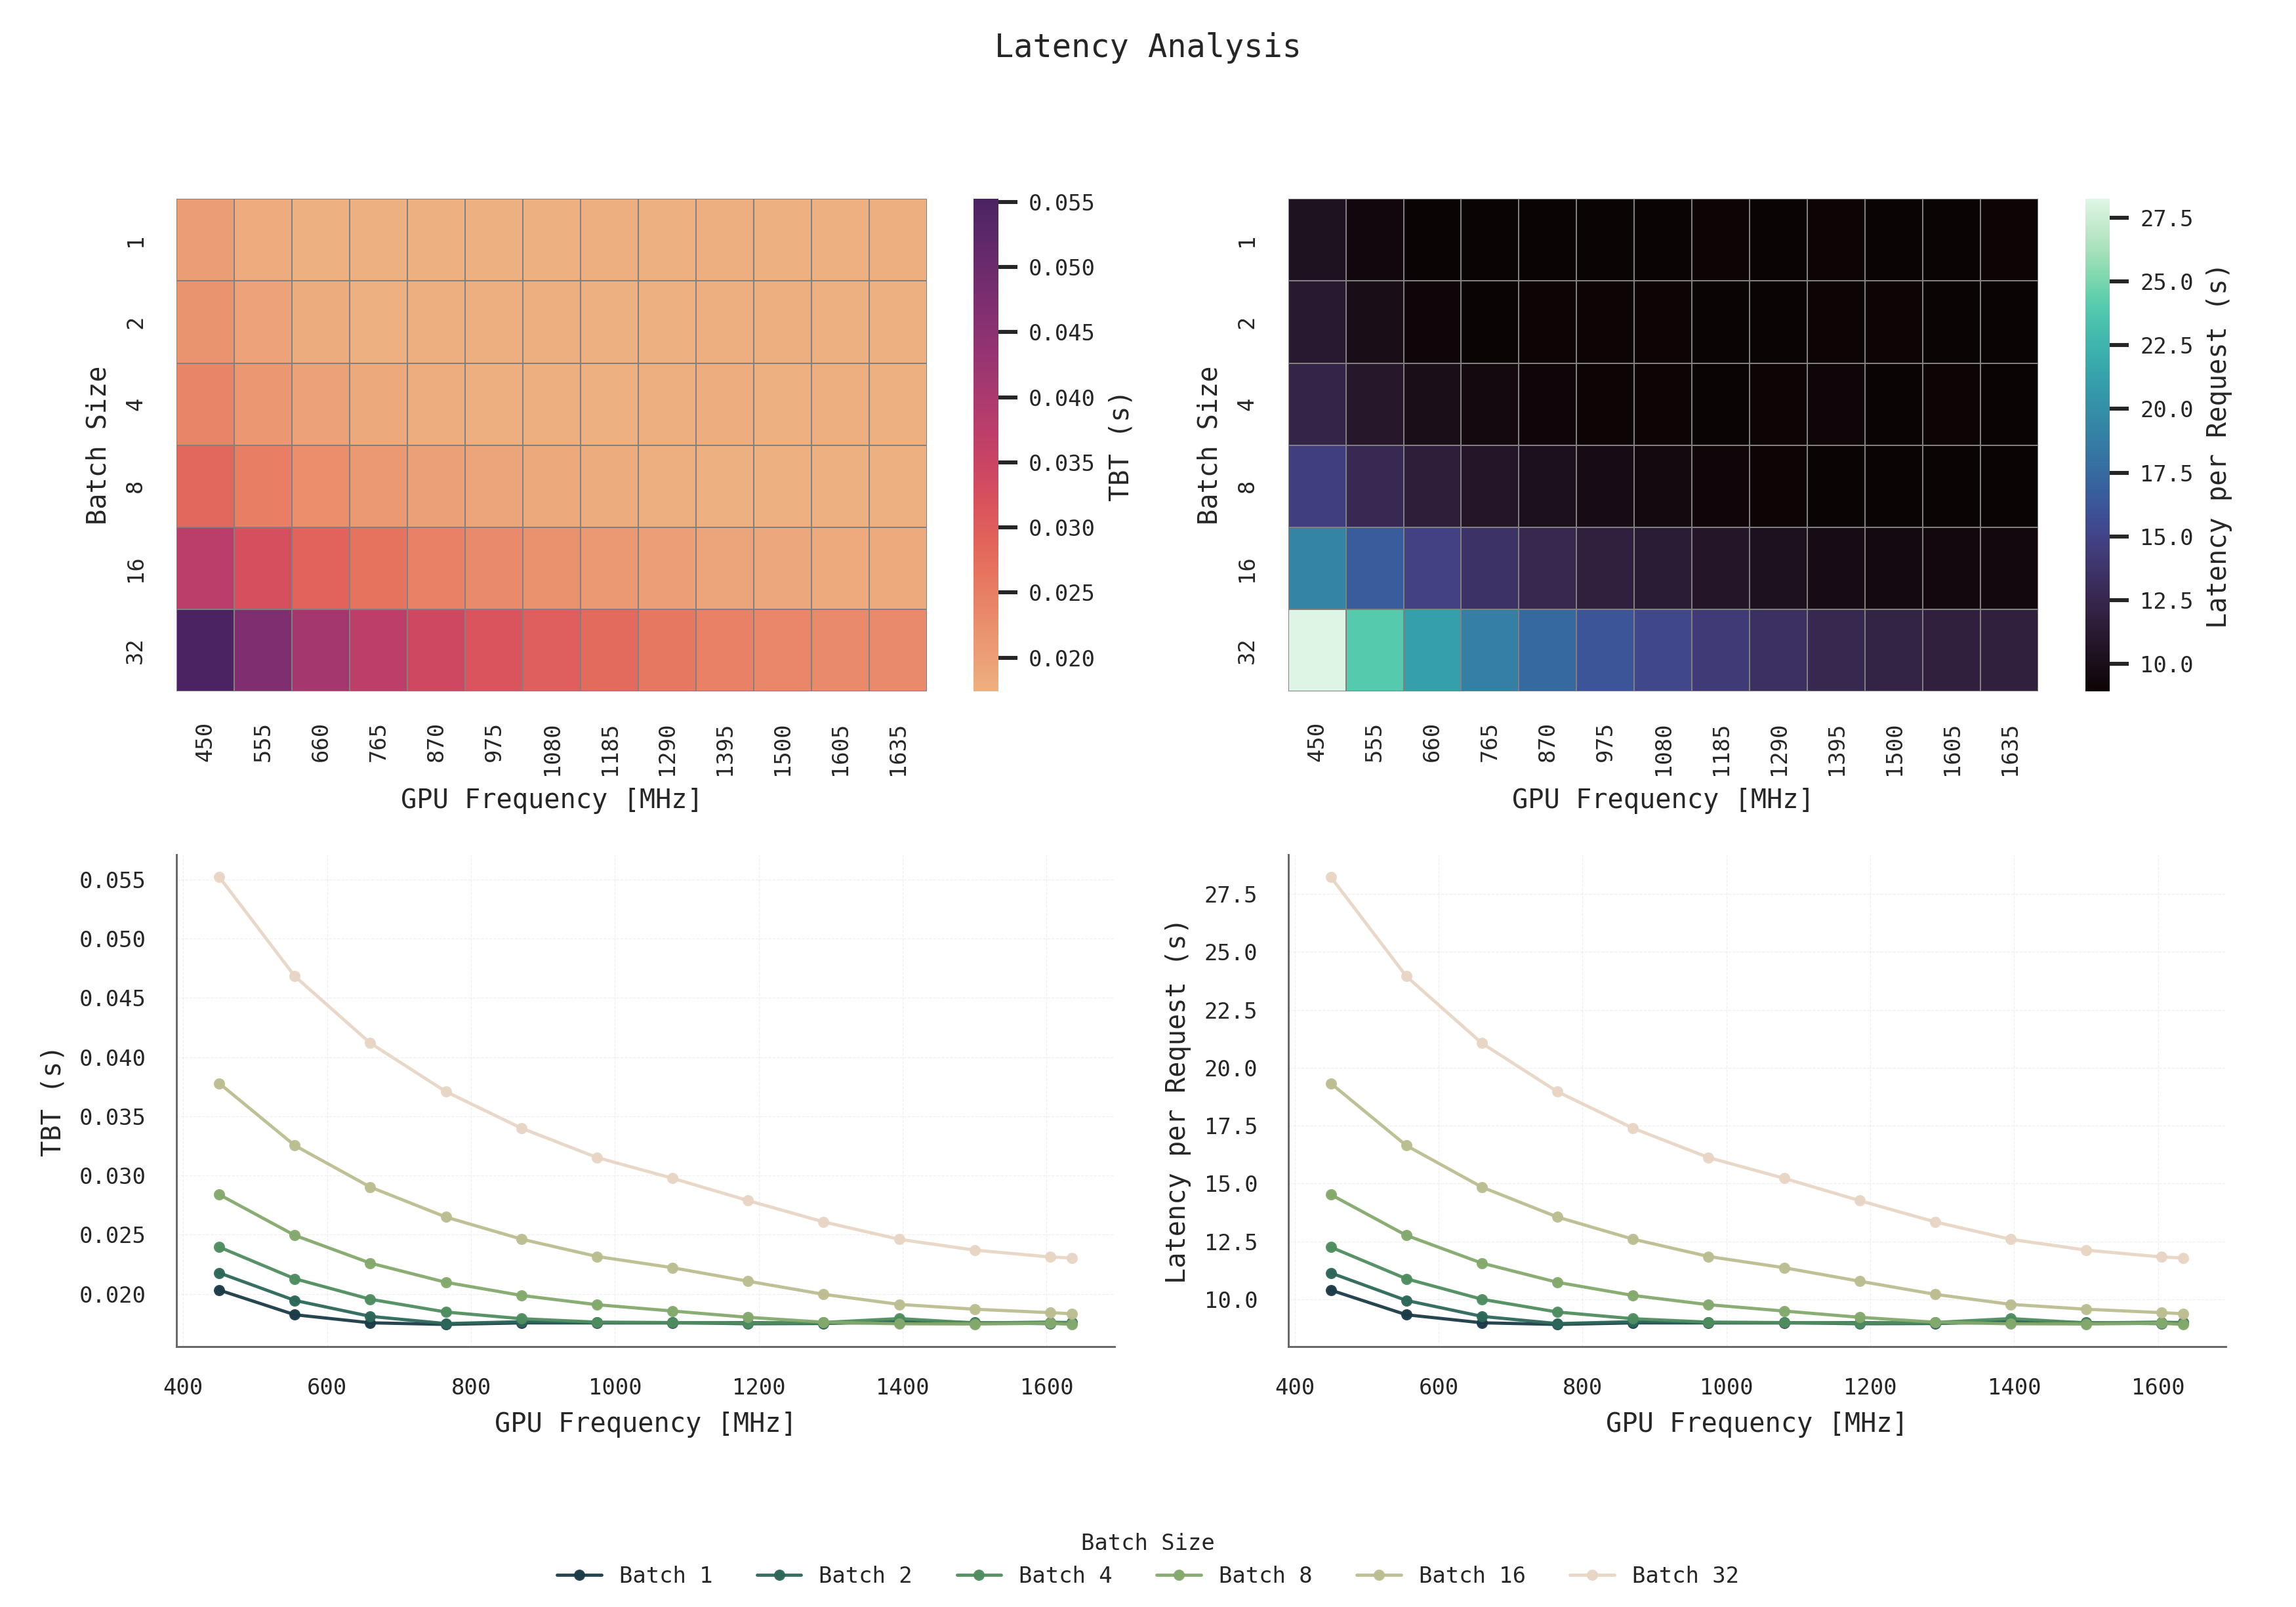 Figure 2: Latency Analysis: Impact of batch size and GPU frequency on Time Between Tokens and End-to-End latency.
4.3 Throughput Analysis
Throughput increases steadily with both batch size and frequency. Batch 32 around 1600 MHz achieves the highest tokens-per-second rate. Even at lower frequencies, larger batches outperform smaller ones in throughput.
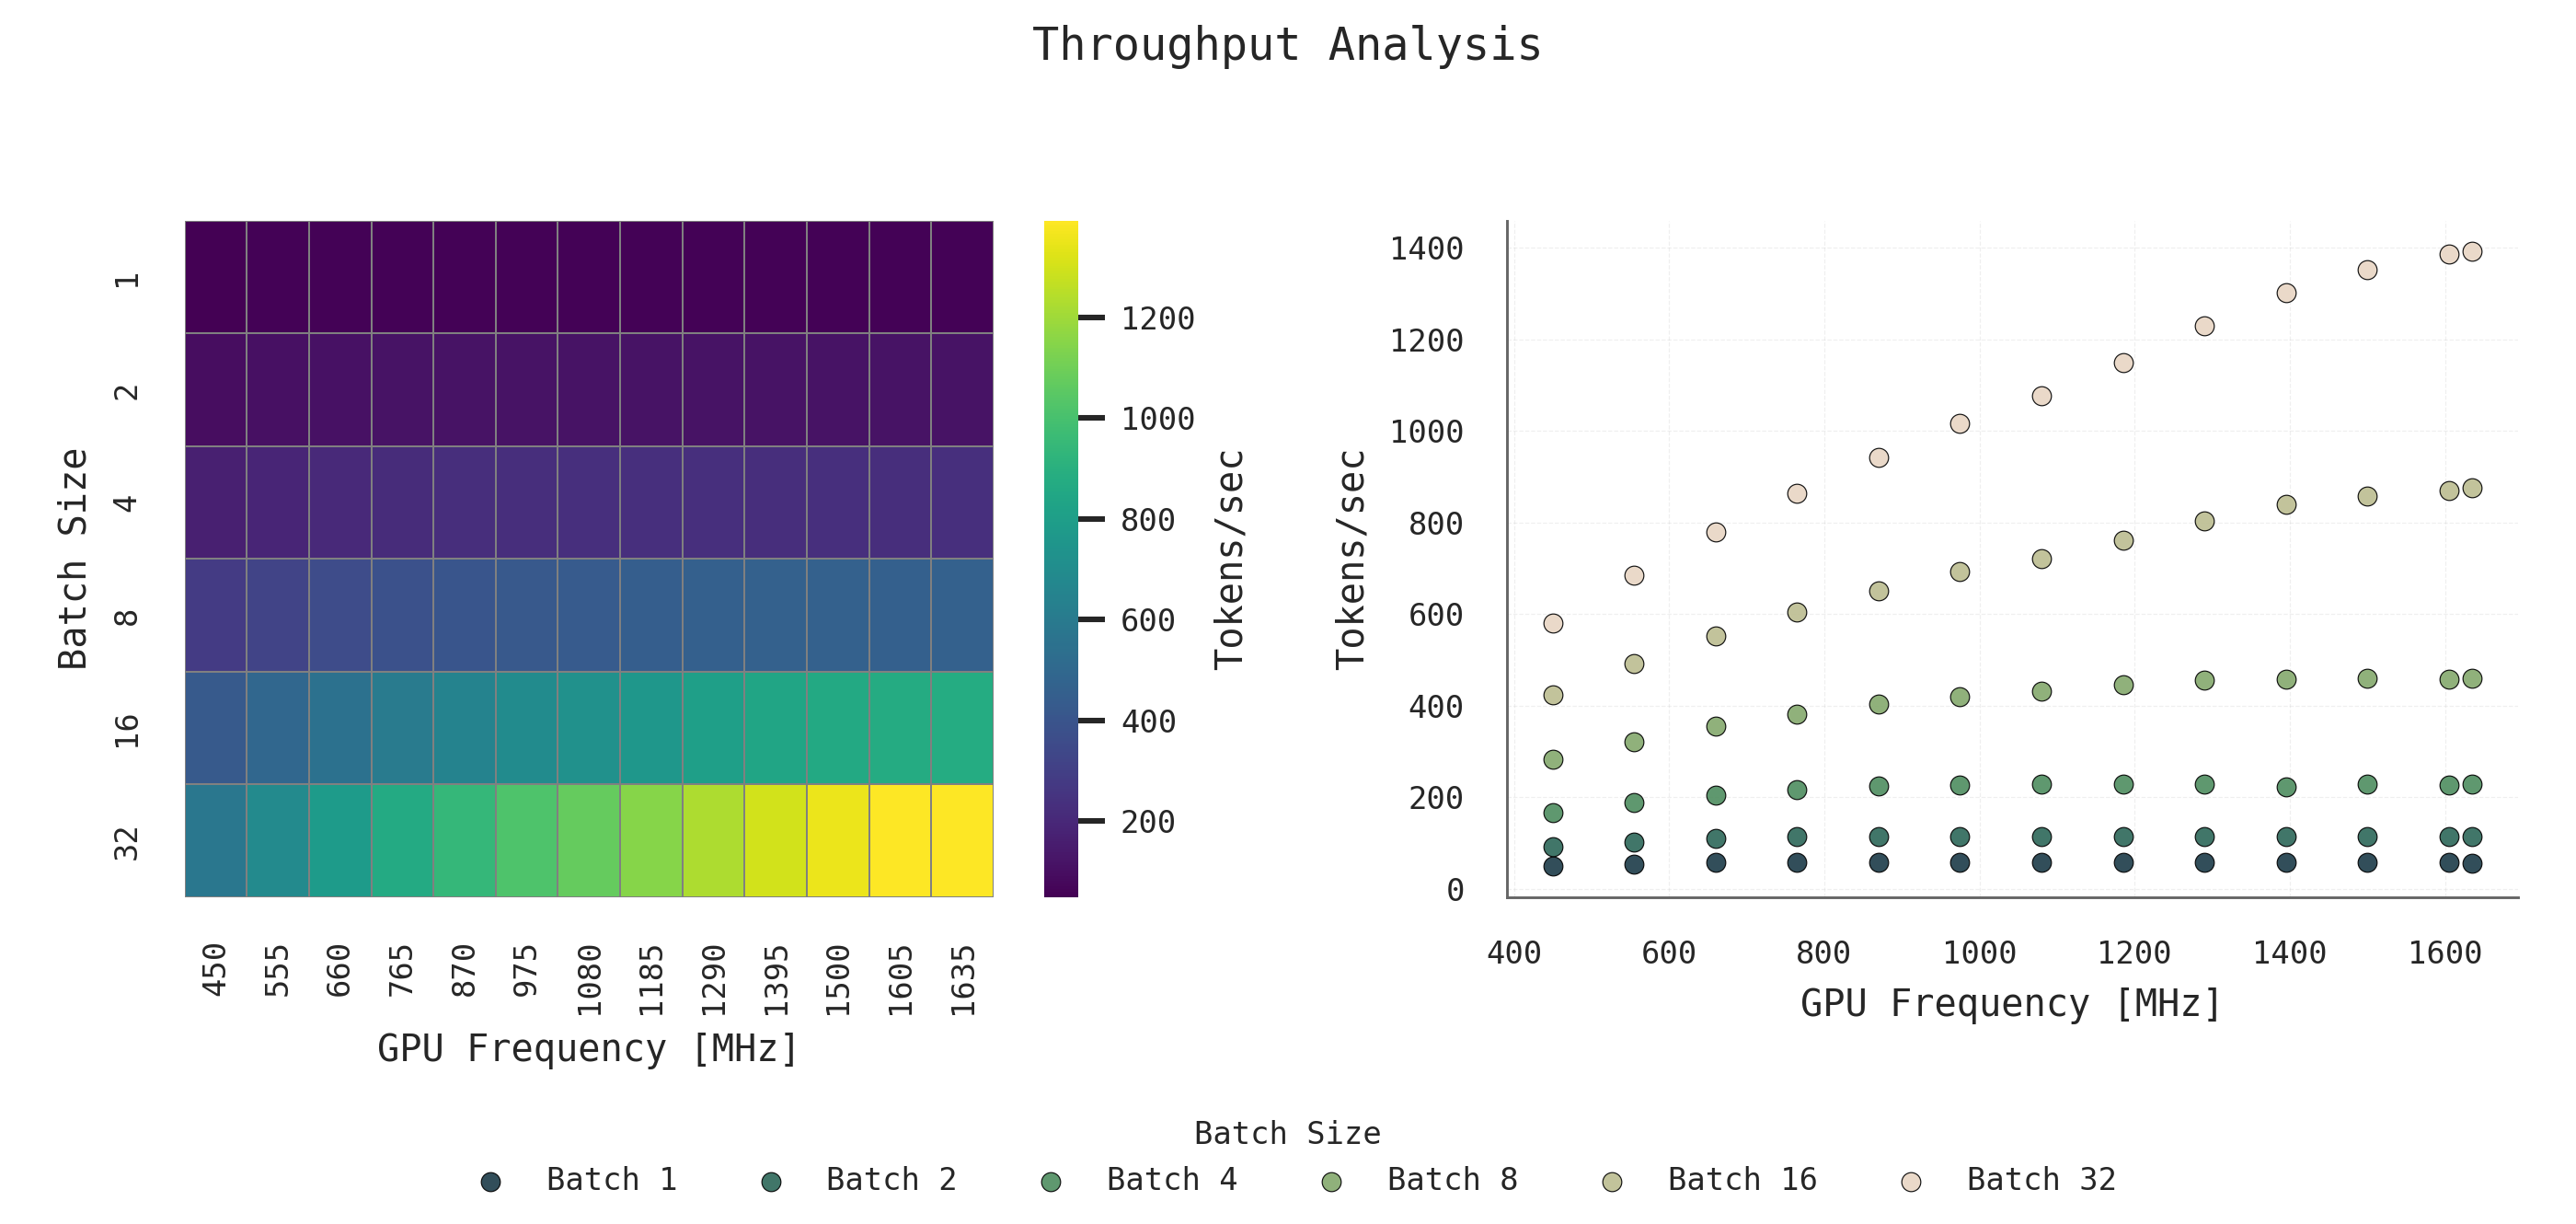 Figure 3: Throughput Analysis: Throughput (tokens/sec) scales with batch size and GPU frequency.
5. Summary of Trade-offs
| Serving Goal | Best Batch Size | Best GPU Freq | Notes |
|---|---|---|---|
| Energy Efficiency | 32 | 1000–1400 MHz | High TPJ and low energy per request; power draw is reasonable. |
| Low Latency | 1 or 2 | ≥700 MHz | Low latency even at modest frequency; good for responsive applications. |
| High Throughput | 32 | 1400–1600 MHz | Maximizes tokens/sec for high-load environments. |
Model Dependency
These observations are based on the LLaMA 3.1–8B model. While exact values may vary across models, the overall trends with respect to batch size and GPU frequency are expected to remain consistent.